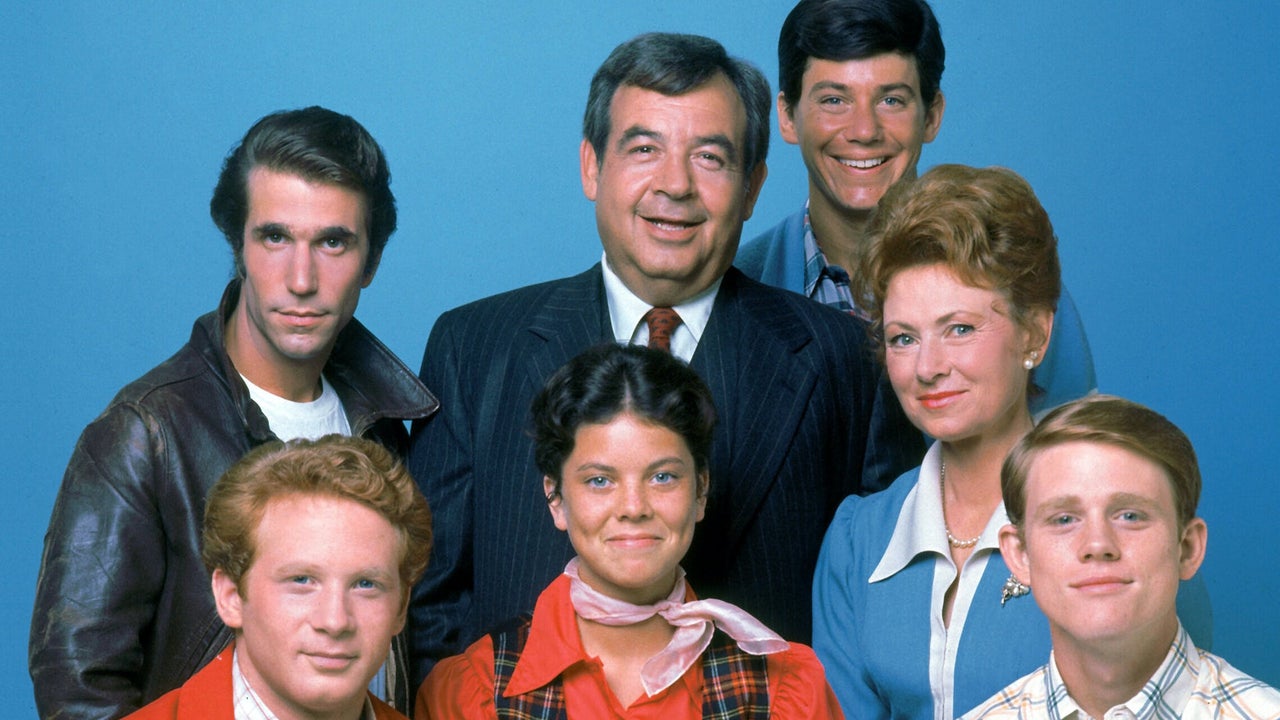

As a TV executive, you are always looking for ways to make more informed content decisions, especially when it comes to acquisitions and programming. One way to achieve this is by leveraging demand data to evaluate the worth of a show. In this regard, we can use the example of "Happy Days" to examine how demand is related to content valuation.
Using Parrot Analytics demand data for the United States market in February 2024, we can see that "Happy Days" had a good level of demand, being 7.6 times more demanded than the average show in the country. Additionally, it ranked at the 96.6th percentile in the history genre, indicating higher demand than 96.6% of all history titles in the United States. These figures give an initial indication of the potential value of this show.
Further analysis of this show on a rolling year and monthly basis reveals some interesting insights into its popularity. Although "Happy Days" had a peak demand of 13.3 times the average over the course of the entire year, it peaked at 9.8 times the average in the last 30 days. This is a 26,9% increase, but the show's average demand on a rolling year basis was 8.3 times the average title, compared to 7.6 times the title average for the last 30 days, suggesting that "Happy Days" has become less popular recently.
Furthermore, by examining how well "Happy Days" has traveled outside its home market, we can evaluate its global performance and franchise potential. The Parrot Pulse for "Happy Days" revealed that its worldwide audience demand across all platforms is good, while its travelability (international demand relative to its home market) is okay. Its momentum (the pace of growth) and franchisability (spin-off potential) are also okay. Its reach, which measures the number of people expressing demand for a show, is also okay.
Using demand data can also help with other content-related decisions for an executive. For example, by examining the top 10 global markets where "Happy Days" is most in-demand over the last 30 days, we can see how well it is performing in these regions. The show outperformed the demand of the average TV show (1x) in each of these markets, with the United States being its number one market globally. Comparing its demand performance in other markets, we can see that its demand is good in Canada, Italy, and okay in France, Australia, the United Kingdom, the Netherlands, New Zealand and Romania. This information can be useful in making decisions on where to distribute or acquire the show.
In conclusion, demand data is a valuable tool for TV executives in making more informed content decisions. By examining the demand for a show like "Happy Days," executives can determine its value and make decisions on programming, acquisitions, and distribution. The demand data can also reveal insights into a show's global performance, including its travelability, momentum, and franchisability, among others.