The Demand Distribution curve illustrates how a TV show’s popularity compares to the demand benchmark, which is a measure of the average demand across all titles. The curve is divided into performance buckets, ranging from “Below Average” to “Exceptional”. A show falls into one of these performance buckets depending on how many times more or less demand it has compared to the demand benchmark.
The show’s performance is market-specific, e.g. the same show can be in the “Average” range in the United States and in the “Good” range in France.
As an example, if a show has 9 times more demand than the demand benchmark, it falls in the “Outstanding” performance range; only 2.7% of all shows in the market reach this high level of demand.
For entertainment executives, the use of demand data is essential to understand how content is performing across multiple markets and how it is affecting their platforms. Using Parrot Analytics demand data, we can gain insights into content valuation, the global appeal of content, and how to make informed content acquisition, distribution, and programming decisions.
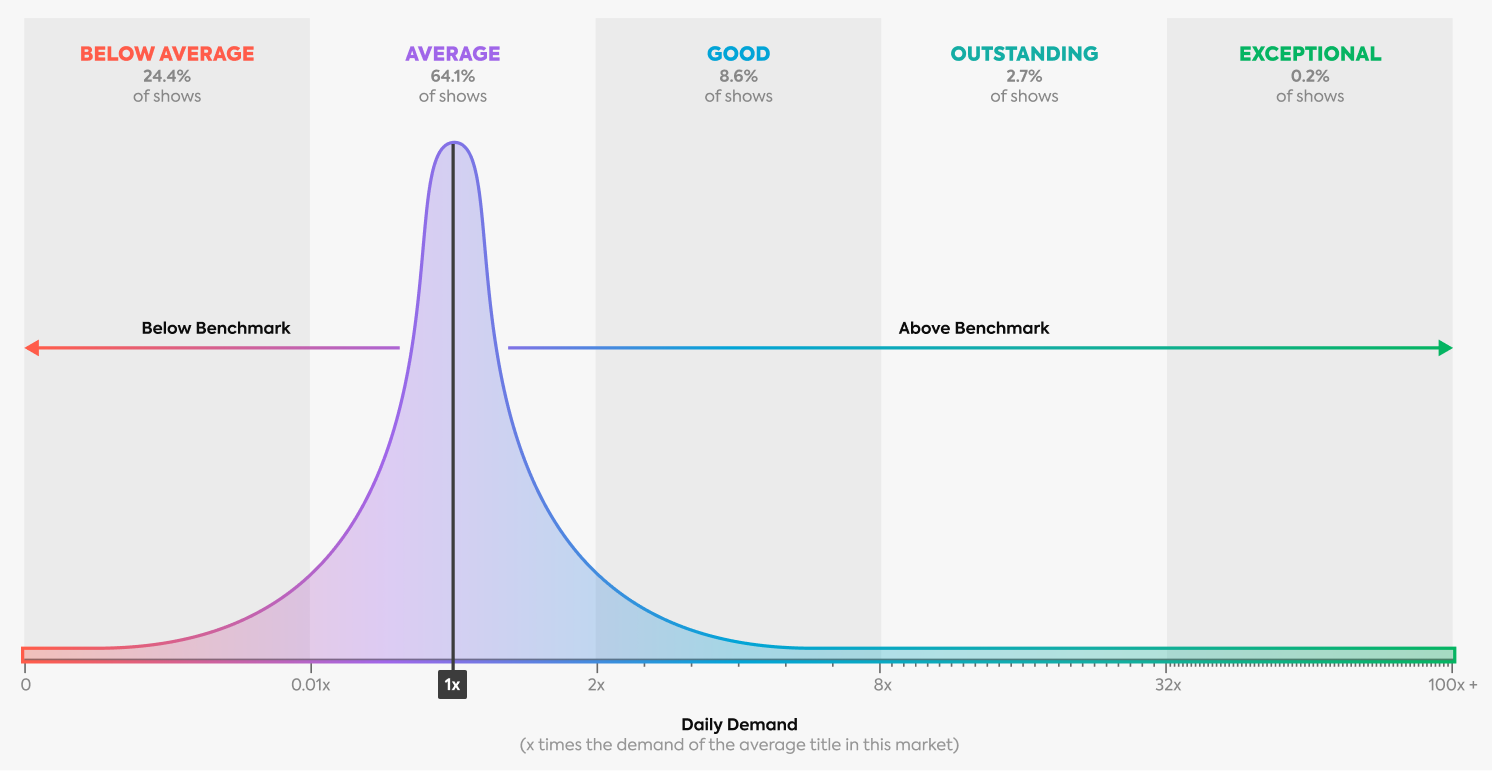
For example, let's take a look at the demand data for the TV show "Sweet Magnolias" in Australia in the month of March 2024. With 3.1 times the audience demand of the average show in Australia over the last 30 days, demand for "Sweet Magnolias" is good, and only 8.6% of all TV shows have this level of demand. This demand trend has been increasing recently, with this show achieving a peak rank of #748 in Australia. Although this show dropped 412 spots during March, it still ranks at the 97.9th percentile in the romance genre. This means "Sweet Magnolias" has higher demand than 97.9% of all romance titles in Australia.
Further, audience demand for this TV show has decreased in Australia by a staggering 42.7% throughout March. However, demand spiked towards the end of March 2024. Through Parrot Analytics demand data, executives can uncover their audience's preferences specifically in different markets and overtime, gauge a show's longevity, measure its momentum, visualise it’s travelability, analyze its franchisability and reach.
The Parrot Pulse provides independent measurement of its global performance across six dimensions: worldwide audience demand, travelability, longevity, momentum, franchisability and reach. Thus, the demand for "Sweet Magnolias" was 37% of the demand in its country of origin, the United States. This quantifies a show's international demand relative to its home market. While its momentum and worldwide audience demand across all platforms are good, there is room for improvement in other areas such as its travelability, franchisability, and reach.
Comparing "Sweet Magnolias" performance on a 1 year rolling basis vs the last 30 days reveals insights such as the peak demand in the last 30 days is 29.2% higher than the peak average over the course of the year. The show's average demand on a rolling year basis was 2.4 times the average TV show, compared to 3.1 times the title average for the last 30 days. This indicates that "Sweet Magnolias" has an increased popularity that decision-makers can consider.
It is also notable that "Sweet Magnolias" outperforms the average TV show in its top ten global markets, including Australia, Canada, Germany, the United Kingdom, and Spain. The United States is the show's top global market, achieving outstanding audience demand. The show has proved to have a good demand in every market where it airs, providing executives with actionable insights to make informed decisions.
By leveraging Parrot Analytics demand data, entertainment executives can make strategic decisions to identify potential hit shows that resonate with the global audience that is also scalable, measuring a show's franchisability overtime, influence distribution and programming decisions, make informed content acquisition decisions, and ultimately maximise the platforms' growth and profitability. AndAlso, by using demand data executives can value content and make an informed decision on how much to spend when buying or producing content. How can a TV executive calculate the ROI, a particular title will bring for any given platform? By using Market-specific audience demand.
Sweet Magnolias's travelability to Australia in the last 30 days is 33%, which means that the audience demand for Sweet Magnolias is 33% of the demand in its country of origin, United States. Click through to another market to discover how well Sweet Magnolias travels internationally.
Answer one question and put our thinking to work on your challenges.
Who are you in the industry?
Capture more value from content opportunities in Australia as well as globally. Contact us now to leverage audience profiling, market-based insights, talent scoring and genre clustering to de-risk production investments. Discover new business opportunities in the Drama genre and assess the strengths and weakness of the competition’s content e.g. Netflix, leading to increased commercial efficiency and ROI.
Support casting decisions with empirical market data for Australia. Contact us now to reveal hidden talent insights, through a combination of affinity and trait analysis, encompassing both global and market-based factors to determine who is truly worth an investment. Discover new business opportunities and assess the strengths and weakness of the competition’s offerings including specific titles such as Sweet Magnolias.
Produce with confidence whilst mitigating downside risks. Contact us now to decrease production risks by combining content genome insights with demand data to increase the likelihood of a successful series: Gain deep insights into character, talent, setting, plot, theme and genre preferences, including Drama. Using audience demand data, explore markets such as Australia to discover lucrative new sales opportunities whilst evaluating the expected ROI for new series acquisitions such as Sweet Magnolias from partners like Netflix.
Studios in Australia are now empowered to fuse art with science for the next global hit. Contact us to gain deep insights into target audiences’ character, talent, setting, plot, theme and genre preferences (e.g. Drama) - for both local and global content. Find the best performing concepts with demand-driven concept testing and development. Apply talent demand to gain a holistic view of future content performance, pre-development.
Are you seeking distribution for Sweet Magnolias? Lead global content negotiations with authority. Contact us now to discover if you should prioritize markets such as Australia, based on country-specific audience demand - including territories where commercial rights have not yet been granted. Apply a demand-based framework to negotiations with potential distribution partners such as Netflix to maximize the deal value. Assess the strengths and weakness of the competition’s content, leading to increased commercial efficiency and ROI.
Maximize advertising revenues from new audiences in Australia. Contact us now to leverage a return-focused selection criteria for title acquisition from Netflix by incorporating country-specific trend and market demand factors. Appeal to audience interests using demand-driven advertising and personalize campaigns to capitalize on pre-release demand for specific titles such as Sweet Magnolias. Access audience taste clusters weeks ahead of a premiere, resulting in high impact campaigns for titles that have not even been released.
Acquire the best shows from partners such as Netflix to fortify your competitive position in Australia. Contact us now to access audience taste clusters weeks ahead of a premiere, resulting in high impact campaigns for titles (e.g. Sweet Magnolias), including those that have not even been released. Leverage a return-focused selection criteria for title acquisition by incorporating country-specific trend and market demand factors.
Command your Drama genre niche with maximum net subscriber adds. Contact us now to harnesses audience demand data to gain insights for growing and keeping a subscriber base. Leverage a return-focused selection criteria for title acquisition from partners such as Netflix by incorporating country-specific trend and market demand factors for all markets including Australia. Appeal to the individuality of your audience base, taking into consideration the unique and limitless characteristics of taste clusters.
Deploy high impact entertainment marketing strategies across all genres including Drama. Contact us now to deploy demand-driven marketing, the only empirical earned media measure of your marketing spend. Access audience taste clusters weeks ahead of a premiere, resulting in high impact campaigns for titles such as Sweet Magnolias, including those that have not even been released. Appeal to your target markets, including Australia, based on audience interests, enabling the personalization of campaigns to capitalize on pre-release demand.
Our TV audience measurement dataset is truly global. Discover how popular Netflix‘s Sweet Magnolias is in any of the following selected markets. Need data for other markets? Find out more about DEMAND360LITE.
Parrot Analytics is the leading global content demand analytics company for the multi-platform business of television. With the world’s largest TV audience demand dataset, the company currently tracks more than 1.5B daily expressions of demand in 100 languages, not only in Australia, but also in 100+ other markets around the world to reveal the television content that consumers watch (viewership) and give their attention to the most.
Parrot Analytics' television demand data highlights the global TV content monetization opportunities for Netflix and thousands of TV studios, linear networks, broadcasters, pay TV providers and OTT / SVOD platforms.
Unlike TV ratings, our DemandRank TV rating system ensures that important demand signals are weighted more heavily than others: The more consumer effort required; the more importance is attached to each signal. Once all the signals are weighted and combined, the audience demand for Sweet Magnolias, for example, can be assessed for a market e.g. Australia, which can then be benchmarked against genre averages (e.g. Romantic Drama), using our globally standardized Demand Expressions® metric.
This page has been altered on April 22, 2024, 2:01 p.m. PST using global tv demand analytics from Parrot Analytics for Sweet Magnolias in Australia. We provide our partners with essential media industry workflows to help them drive better and more informed content advertising strategies. Contact us today to find out more.